
Simulation
The final film profile over a given topography is determined by three operations during the application process: spincoating, post-spincoat leveling, and UV exposure. Each operation introduces different forces that affect the leveling capability of the topcoat. The goal of our simulation efforts was to develop a fully integrated model that begins with topographic and material inputs and accurately predicts the final profile and critical leveling time after all three unit processes, while minimizing computation time.
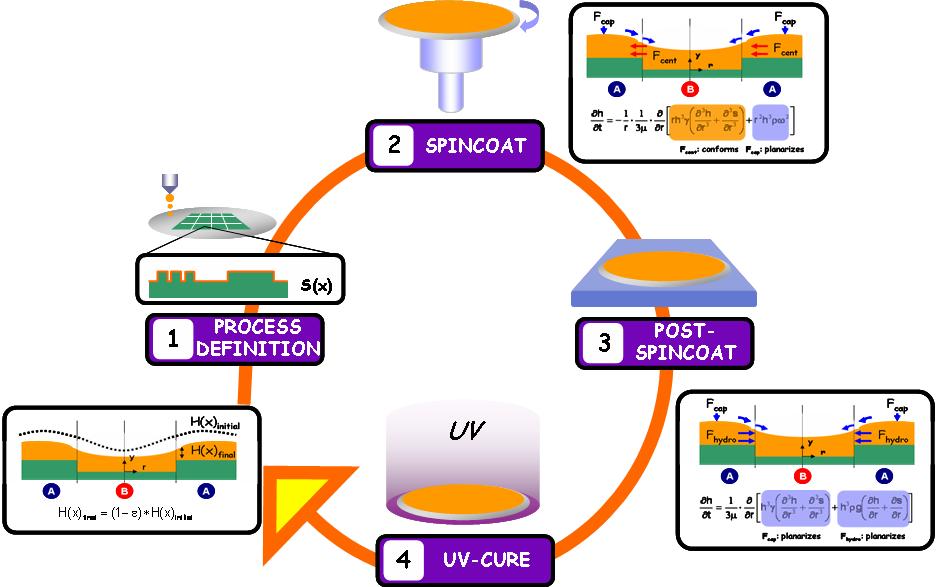
Figure 6. Flow scheme of the integrated planarization model.
Spincoating
Film leveling while spincoating a nonvolatile fluid is an equilibrium problem; the final film profile is determined when the net force among capillary, centrifugal, and viscous contributions is zero. The governing equations and numerical simulation of nonvolatile fluid leveling during spincoating were first introduced by Stillwagon and Larson1, and the analysis presented here employs the same equations, numerical methods, and nomenclature to study planarization during spincoating over isolated trench and line patterns.
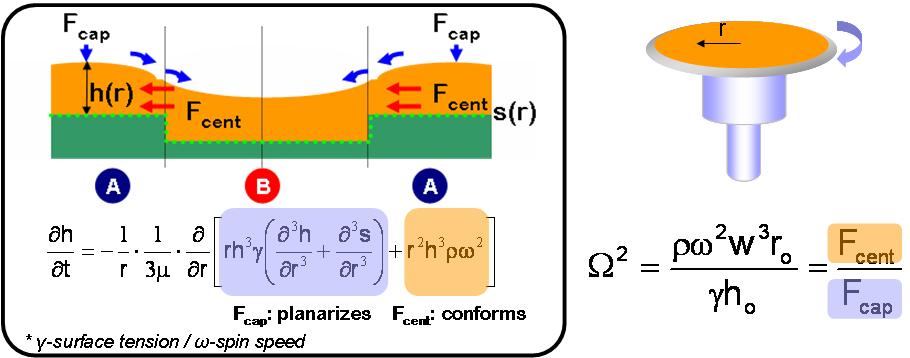
Figure 7. Spincoating model setup.
The governing parameter during spincoating is the dimensionless O2 value, which is a ratio between centrifugal and capillary force.
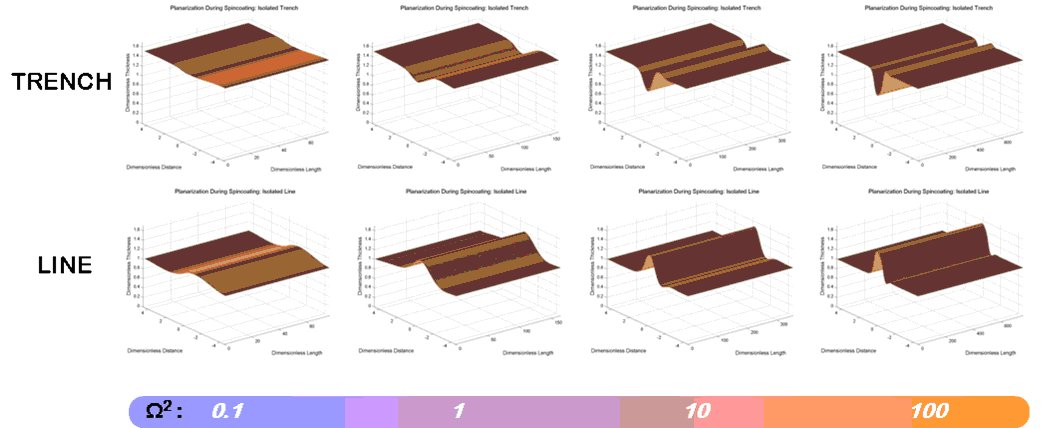
Figure 8. Simulated film profile as a function of Ω2
For small Ω2 values, the capillary force, which tends to planarize films, dominates and the film profile has a high DOP, while centrifugal force, which tends to generate conformal films, dominates at large Ω2 values. Therefore, minimizing the Ω2 value generally improves planarization during spincoating. The DOP is also affected by ho/d (the ratio of the film thickness to pattern height) as shown below.
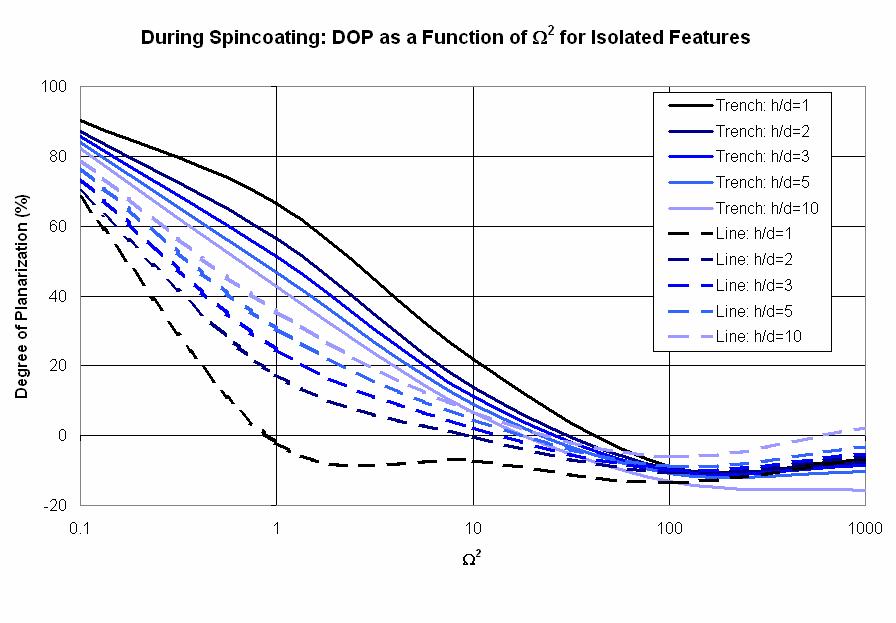
Figure 9. Master curves of DOP as a function of Ω2 for isolated trenches and lines at various ho/d values.
For Ω2 values between 0.1 and 100, planarization is typically easier over trenches versus lines, while for Ω2 values above 100, the curves converge, and planarization is essentially the same regardless of geometry or film thickness. Planarization over trenches can be improved by decreasing the ho/d ratio; however, this trend is opposite for lines. As the ho/d ratio increases, the curves once again converge and planarization becomes insensitive to the underlying topography. The final film profile that is achieved during the spincoating simulation becomes the starting point for the next step, the post-spincoat leveling module.
Post-Spincoat Leveling
Immediately after the wafer stops spinning, the coating begins to planarize under capillary and hydrostatic forces. Since both forces work to level the film, this problem becomes dynamic the film profile is a function of time. The model presented here employs Stillwagon and Larsons2 original equations, numerical methods, and nomenclature to study planarization after spincoating over isolated trench and line patterns.
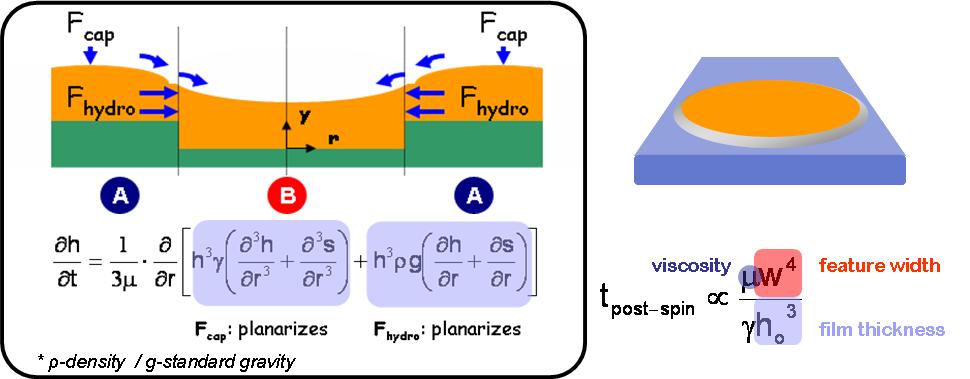
Figure 10. Post-spincoat leveling model setup.
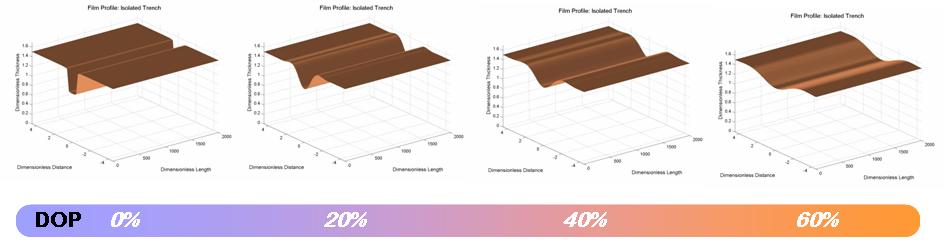
Figure 11. Simulated film profile over an isolated trench at various stages of the post-spincoat leveling process.
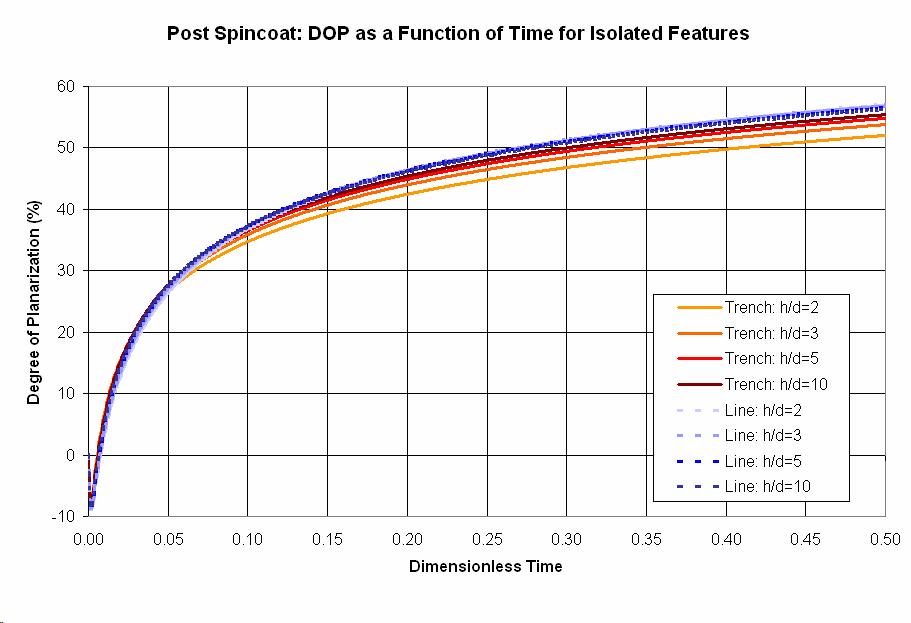
Figure 12. Post-spincoat leveling over trenches and lines at various ho/d values.
It is clear that planarization over trenches improves as ho/d increases. On the other hand, increasing the ho/d ratio does not have as significant of an impact on planarization over isolated lines; the mechanism for planarization of lines resembles isolated trenches with large ho/d values there is essentially one master curve. For our simulation, once the DOPcrit has been achieved, the final film profile becomes the initial conditions for the next step, the UV exposure module.
UV-cure
The final film profile needs to be adjusted to reflect uniform shrinkage throughout the film that results from the UV curing process. It is assumed that the vertical shrinkage is much greater than horizontal shrinkage. Therefore, the post-exposure shrinkage is represented as a constant multiplied by the film thickness.
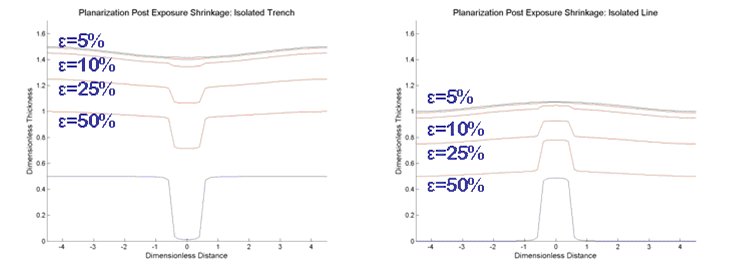
Figure 13. Post-exposure shrinkage for isolated trench and line patterns.
The larger the degree of shrinkage the larger the degradation of the final film profile. On the microscopic scale, there is flow of material in the lateral direction that would smooth out the profile and slightly increase DOP; however, the simulation provides a worst-case scenario where there is no flow in order to generate conservative calculations of the critical DOP and leveling time.
Continue reading >> Material Design