
Feature Filling
Feature filling model
The imprint step in the SFIL process is crucial for reverse replication of template features on a substrate. Several droplets of low viscosity, photopoly-merizable monomer as small as 10 pL each are dispensed on a substrate using piezo-driven inject dispense system. The capillary forces facilitate the liquid spreading and pull the liquid up into the features etched on the template. The model presented here considers the case where an array of pores (template features) lands directly over a liquid drop on the substrate, and air or helium in the inert environment gets trapped inside the pores. The inert environment is essential to improve the solubility and the diffusivity of the entrapped gas in the liquid resist.
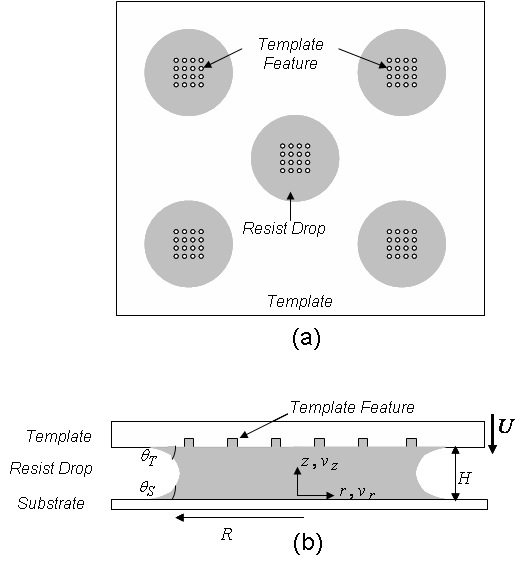
Figure 3: (a) Top view of the imprint system showing the template features landing directly over the liquid resist drops. (b) Side view of the imprint system showing the residual thickness and the drop radius. For clarity purpose, only one of the many dispensed liquid drops (not to scale) is shown in the figure.
As the template approaches the substrate, the thickness of the residual layer (the liquid resist film between the template and substrate) decreases (see Fig. 3). Since the residual layer thickness is much less than the radius of the drop and the Reynolds number of the liquid flow is low, one can apply the lubrication approximation to greatly simplify the Navier-Stokes equation. Using the simplified Navier-Stokes equation and the equation of continuity with suitable boundary conditions (ignoring any gravitational contribution), the following pressure and velocity profiles result across a single drop com pressed between the template and the substrate:
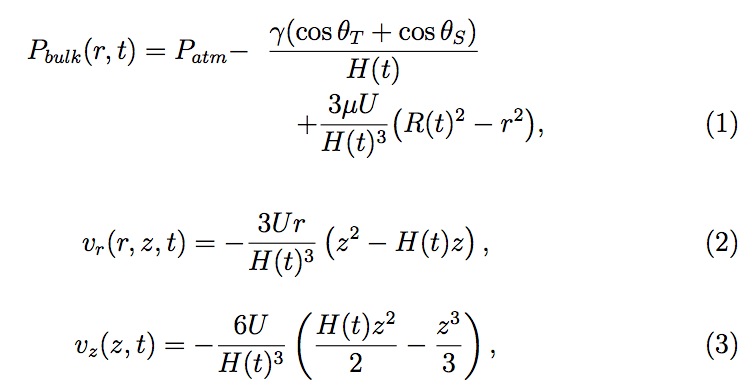
where Pbulk and Patm are the liquid bulk and the atmospheric pressure; vr and vz are the radial and normal (in +z direction) velocity; θT and θS are the contact angles of liquid with the template and the substrate, respectively; γ and μ are the surface tension and the viscosity of the liquid; U is the template velocity in -z direction; R and H are the radius and the residual layer thickness of the liquid drop (see Fig. 3). Knowing U , one can determine H (t) and R(t) applying the conservation of volume of the liquid drop (density is assumed constant). Throughout this study, we have considered the case before one drop merges with another drop.
Now once Pbulk is obtained, the rate of fluid filling into the pores on template, vzp (see Fig. 4), can be estimated using Hagen-Poiseuille law
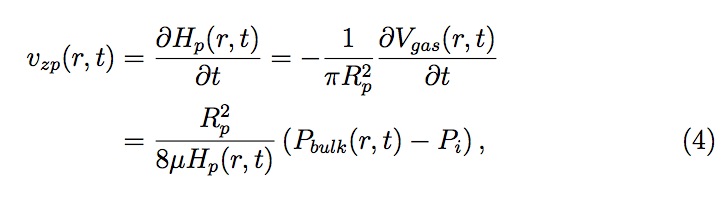
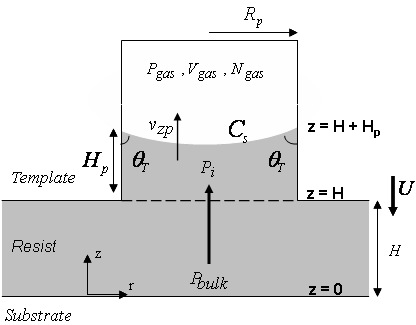
Figure 4: Schematic (not to scale) of gas entrapment in a pore of radius Rp with liquid level Hp . Pgas , Vgas and Cs represent the pressure, volume and the surface concentration of an entrapped gas, respectively. vzp represents the velocity of the liquid interface (filling rate) inside the pore.
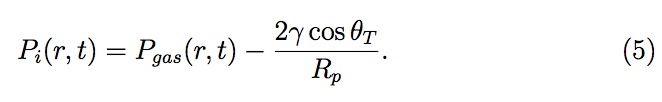
where Hp is the height of the liquid in a pore, Rp is the radius of a pore, Vgas is the volume of the entrapped gas in a pore and Pi is the pressure in the liquid at the interface inside the pore. All the values for a pore are evaluated as a function of its distance, 'r', from the center of a drop (see Fig. 5). Pi is estimated using Young-Laplace equation as follows
Now, Pgas , the pressure of entrapped gas in a pore at distance r from center, can be related to moles (Ngas ), volume (Vgas ) and temperature (T )
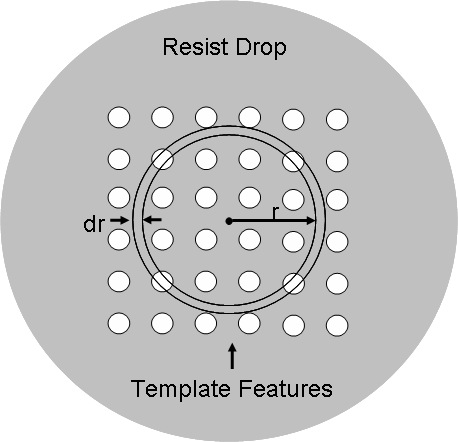
Figure 5: Top view of a liquid drop (not to scale) with template features (array of pores) landing directly over it. The origin of radial coordinate is at the center of the drop as shown above.
of the gas using equation of state

As described earlier, entrapped gas in the template features escapes by
diffusing through the liquid resist. The rate of change in number of moles
of a gas  is dependent on the gas concentration gradient at the liquid
surface inside the feature.
is dependent on the gas concentration gradient at the liquid
surface inside the feature.
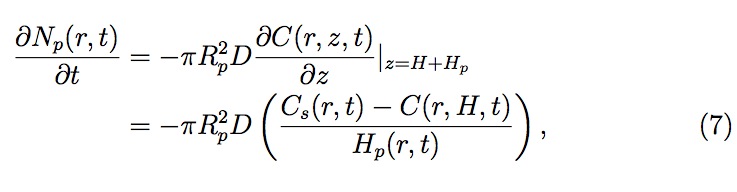
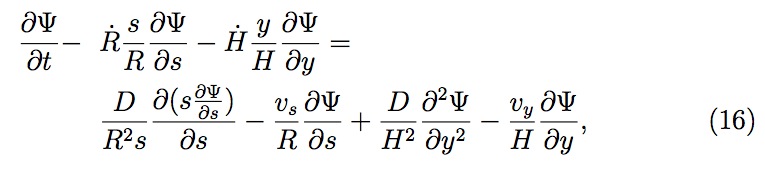
where C and Cs are the gas concentrations in liquid in the bulk (across the drop) and at the surface (inside the pore), respectively, and D is the diffusivity constant for gas dissolving into liquid. For computational simplicity, a linear gas concentration profile is assumed in the liquid within the pores. To determine C (r, H, t), the gas concentration at z = H (see Fig. 4), one should evaluate gas concentration profile across the liquid drop (see Fig. 3). The gas concentration profile across the liquid drop can be obtained solving a gener alized (constant diffusivity) diffusion equation (Eq. (8)) using the previously derived velocity profiles (Eqs. (2) and (3))
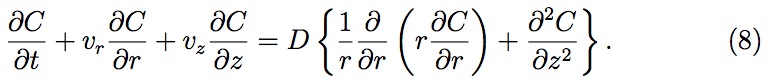
The initial conditions (I.C.s) and boundary conditions (B.C.s) in cylindrical coordinates are given by
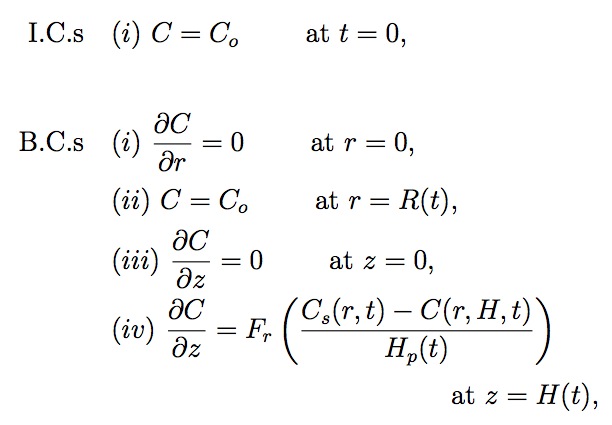
where Fr corresponds to the fractional area actually covered by pores in the elemental ring between radius r and r + dr from center of an array (see Fig. 5), and Co is the gas concentrations in the liquid at the outer interface, respectively. C0 is also the initial gas concentration in the bulk liquid. Cs and Co are determined using Henry's Law
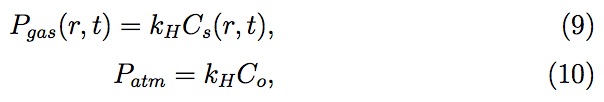
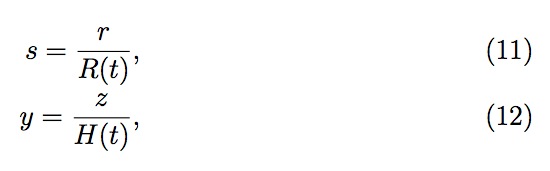
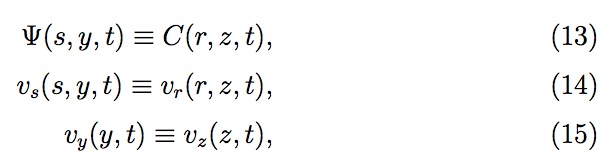
where kH is the Henry's law constant. The generalized diffusion equation 7 with moving boundaries (both in r and z directions) is solved numerically for C (r, z , t) using finite difference equations based on Landau transforma tion, reported by Golosnoy et al.. The Landau transformation involves the following modified variables and diffusion equation:
Summarizing, first the pressure and the velocity profile across the liquid drop are computed analytically in terms of the time variables, the drop radius (R(t)) and the residual thickness (H (t)), using Eqs. (1), (2) and (3). Then the entrapped gas properties (pressure, volume, moles) are evaluated for each pore to determine the gas concentration at the liquid surface inside the pore. Knowing the gas concentration at the surface, the gas concentration profile is obtained for the liquid inside the pore and across the liquid drop on the substrate based on modified positional variables after Landau transformation. The gas concentration profiles establish the amount of gas diffusion from each
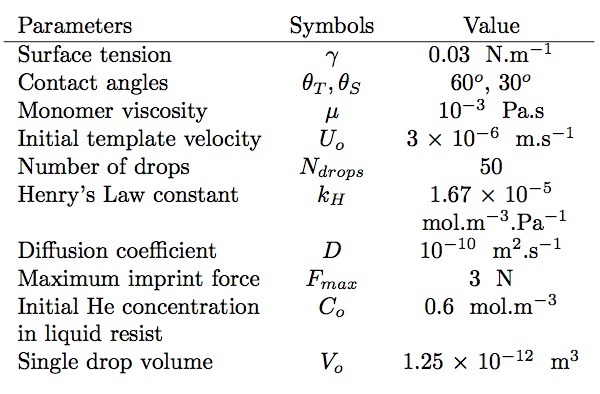
Table 1: Numerical values of the parameters used in the feature filling model simulations
pore. Finally, the amount of gas diffusion and pore properties are used to determine the fluid velocity in pore (i.e. feature filling rate). The liquid is assumed to be saturated with helium at atmospheric pressure as the initial condition.
The equations are solved numerically using the finite difference method. The typical grid size used in the 'r' and the 'z' directions for the finite difference method is 100 x 10. The time step, Δt, is based on the calculated value of the filling rate of the pores such that for each time step the liquid level in pores changes by fixed small amount in the feature. Time t = 0 refers to the point when the template first comes in contact with the liquid resist. The total volume of the liquid drops (Ndrops x Vo ) corresponds to a uniform 100 nm thick residual layer after the imprint step. The numerical value of the parameters used in the feature filling model simulations are listed in Table 2. Note that the template downward velocity, U, is treated as a constant since most of the diffusion occurs during the initial phase of the imprint step.
Gas concentration profile across liquid drop
Fig. 6 shows the gas concentration profile across the liquid drop at 100% filling for a 10 x 10 array of 1μm wide and 1μm deep pores. The concentration profile is shown as a function of modified positional variables ('s' for 'r' and 'y' for 'z'). In particular, s = 0, s = 1, y = 0 and y = 1 represent r = 0, r = R(t), z = 0 and z = H (t), respectively. The positional variables are modified based on Landau transformation to account for moving boundaries both in the 'r' and the 'z' directions. The transformation automatically takes into account the moving boundary conditions by increasing the grid size, appropriately, with each time step. The simplicity of Landau transformation justifies its use over the more complicated method of increasing the number of grids in 'r' and 'z' directions for each time step. It is evident from the Fig. 6 that most of the dissolved gas is concentrated at the center of the liquid drop, while the concentration is Co for the rest of the drop. This profile occurs because in the present case the pores array covers only a small portion of the liquid drop at the center. For computational simplicity, we have assumed the symmetric landing of the pore array about the center of the drop. However, as time progresses, the gas concentration uniformity increases across the drop.
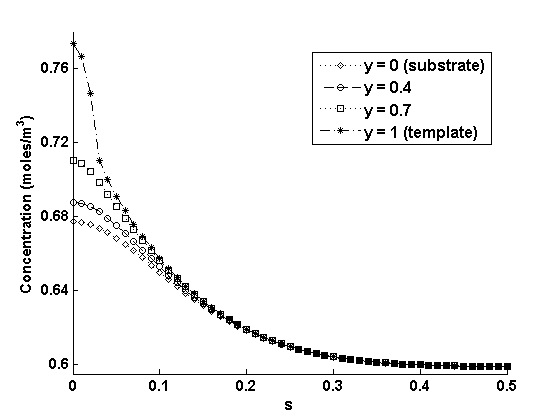
Figure 6: The gas concentration profile across the liquid drop at 100% filling for a 10 x 10 array of 1μm wide and 1μm deep pores.
Feature Filling
Fig. 7 shows the filling progression for 10 x 10 arrays of pores of different sizes. As illustrated in the figure, the pores with larger diameters take longer to fill than the pores with smaller diameters (with same depth) because of the lower capillary action for pores with larger diameters. It is important to note that the initial feature filling occurs orders of magnitude faster than the remainder of the filling. This difference in feature filling time scale is due to the initial low pressure of the gas in the pores (Pgas = 1atm), which causes the large pressure difference (Pbulk - Pi ) when the template first comes in contact with the liquid drop. This pressure difference leads to the sharp rise in the liquid level which increases the gas pressure proportionally because of the negligible gas diffusion during the initial short time span. The higher gas pressure dramatically lowers the filling velocity and thereafter filling is diffusion controlled and slower. As gas diffuses, the gas pressure reduces and the pressure difference (Pbulk - Pi ) increases. Again, the liquid level rises and increases the gas pressure which causes further gas diffusion. Hence, it is a very stable and self-driven process. The static contact angle constraint is relaxed by dynamic contact angle boundary conditions using molecular-kinetic theory for present simulations. Thus, feature filling is pressure-controlled and rapid in the initial phase while it is diffusion-controlled in the later phase.
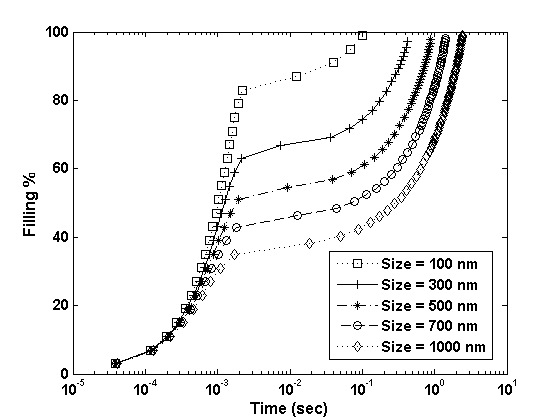
Figure 7: The filling progression for 10 x 10 arrays of pores of different sizes.
Pattern Configuration
Next, we examine the filling time for 10 x 10 arrays of pores of different sizes, depths and pattern densities. Fig. 8(a) shows the filling time as a function of depth for pores of different sizes. It is worth noting that even for an array of pores as large as a micron in size and depth, filling time is on the order of a few seconds. Moreover, the smaller the size, the less time it takes (due to capillary action) to completely fill equally deep features. Fortunately, these attributes are consistent with the two central demands for modern semiconductor manufacturing: high throughput and high resolution. Fig. 8(b) shows feature filling time for 10 x 10 arrays of pores of different sizes at different pitches ranging from 1 to 10. Here pitch is defined as Pitch=(d - dia)/dia, where d is the center to center distance of nearest two pores and dia is the diameter of pores. The feature filling time decreases on increasing the pitch (i.e. decreasing the pattern density). When the pores are spaced farther, their effect on each other decreases and so the effect of pattern density on feature filling time, at higher pitches, is also reduced.
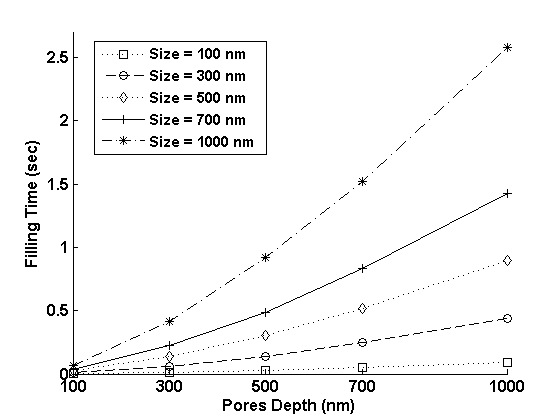
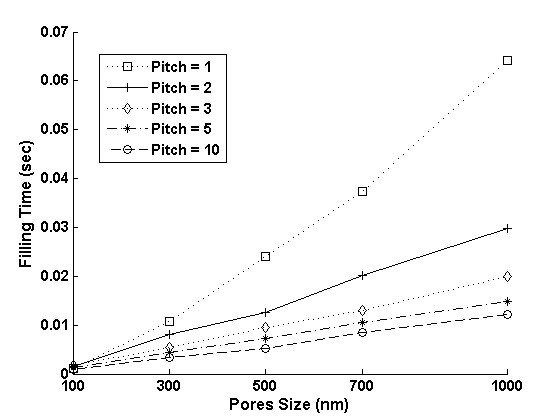
Figure 8: (a) The filling time for 10 x 10 arrays of pores of different sizes and depths, (b) The filling time for 10 x 10 arrays of 100 nm deep pores of different sizes at various pitches.
Recapitulating, the feature filling model for the SFIL imprint step is developed. Feature filling is analyzed in terms of gas diffusion for features (array of pores) of different sizes and depths. In particular, factors including the gas concentration profile across the liquid drop, the filling progression and the total filling time for different pattern configurations are investigated to quantify feature filling during the SFIL imprint step. Simulation results verified the rapid initial filling of features (pressure-controlled). The rest of the filling is diffusion-controlled and occurs more slowly. Nonetheless, the time for diffusion of a gas, entrapped in the features, through liquid resist is not significant and thus eliminates gas diffusion as a cause for non-filling of features during the SFIL imprint process.
Continue reading >> Pinning