| Critical Ionization Model |
| The microelectronics industry owes much of its success to the miniaturization of the integrated circuit. The imaging properties of the photoresists used in the lithographic steps of IC production have enabled this progress to continue. The diazonaphthoquinone (DNQ)/novolac photoresist system claims the most widespread usage due to the 1000-fold change in solubility of DNQ/novolac upon exposure and the excellent etch resistance of novolac. Although the photoresist’s dissolution behavior in aqueous base greatly affects its lithographic performance, much of this process remains unexplained in molecular terms. |
| The probabilistic model proposed here aims to provide a fully molecular explanation for the complex influence of key variables on the dissolution rate of phenolic polymers such as novolac. It rests on the hypothesis that a phenolic polymer, which is below the entanglement molecular weight, becomes soluble when a certain fraction of its phenol groups are deprotonated. If this solubility criterion, rather than mass transfer, limits the rate of dissolution, then this physical process may be described as a function of the probability of deprotonation. Laboratory measurements that tested the model’s predictions for the effect of polymer molecular weight on the minimum base concentration for development support this hypothesis. The model can adequately account for observed effects of residual casting solvent and novolac/inhibitor interactions. No other model for phenolic polymer dissolution predicts all of these behaviors. This evidence suggests that even in a primitive form the probabilistic model captures the important physical elements affecting the dissolution process that are absent from models based solely on diffusion or percolation theory. |
| In a study of the effect of added salt on the dissolution rate of novolac, Tsiartas et al. conclude that the dissolution rate depends on the ratio of ionized to unionized phenolic sites on the surface of the film. One may therefore visualize the dissolution process as a layer-by-layer “etching” of the phenolic sites on the surface by hydroxide ions. Figure 1 provides a cartoon depicting this process. In the limit of a crystal of the monomer, each molecule that becomes ionized switches from the insoluble to the soluble state and quickly transfers into solution. The layer is thus etched away just as a copper surface is etched by nitric acid. One does not need to invoke a gel layer to describe either process. When the degree of polymerization is greater than one, some certain proportion of the phenolic sites on a single chain must ionize in order for the chain to convert from the insoluble to the soluble state; i.e., an imposed solubility criterion, which depends on the degree of ionization, controls the dissolution rate. |
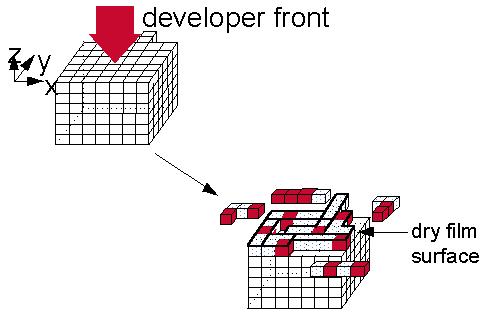 |
| Figure 1 |
| In mathematical terms, a given phenolic polymer
becomes soluble when a certain fraction F of its phenol
groups deprotonate. First, for the sake of simplicity, several obviously
inaccurate and oversimplifying assumptions will be made. The importance
of these assumptions will be addressed later. For simplicity, all phenol
groups are assumed to have equal probability of being ionized; i.e., the
pKa is constant and independent of the degree of ionization. The
issue of “solvent accessibility” is neglected for now, which essentially
implies that all of the monomer units of a particular chain lie in the
same layer of the film. A monodisperse polymer sample is also assumed.
The model system can then be imagined as a thin, solid layer of m phenolic polymer chains, each having n phenol groups or sites, immersed in a bath of aqueous base. If the acid–base equilibria are fast relative to the dissolution rate and the fraction of deprotonated sites is the same on the surface as in the equilibrium boundary layer that contacts the surface, then the deprotonated fraction f of all nm phenol groups on the surface and in the boundary layer may be assumed to be constant. It can be shown that the fraction y of polymer chains that meet the solubility criterion is given by |
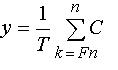 |
| where |
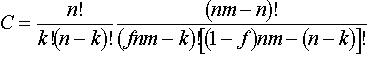 |
| and |
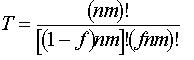 |
| Systems of interest in this work have an extremely large number of polymer chains on the surface that are in contact with the developer. Consequently, a more useful quantity is the limit of y as m approaches infinity, designated Y, which in the limit simplifies to |
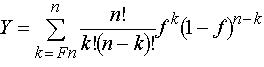 |
| The expression within the summation is the well-known binomial distribution function. The dissolution rate of a phenolic polymer film is proportional to Y, as will be shown later. In addition, f scales with the difference between the pH of the developer and the pKa of the phenolic polymer. Consequently, one can refer to Y as the dimensionless dissolution rate and relate f to the base strength at constant polymer pKa. |
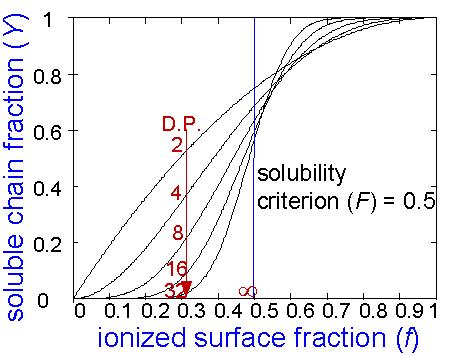
| Figure 2 shows how the dimensionless dissolution rate (Y) of phenolic oligomers having different degrees of polymerization (n) varies as a function of base strength (f). The imposed solubility criterion is that at least half of the sites per chain must ionize for the polymer to become soluble (i.e., F = 0.5). One may easily and correctly deduce from this graph that high molecular weight polymers display nearly a step-function dependence of dissolution rate on base strength. Low molecular weight oligomeric novolac polymers, which are crucial to lithographic applications, have a steep dependence of dissolution rate on the degree of polymerization for base strengths below the condition at which, on average, a fraction F of the phenolic sites are ionized. The curves in this figure demonstrate that f = F represents a base strength corresponding to a turning point in solubility. From this point on, a solubility criterion of F = 0.5 will be used for convenience. |
 |
| Figure 2 |
| The dissolution rate decreases rapidly with
molecular weight for f < F. For f > F,
the analysis predicts a counterintuitive reversal in molecular weight dependence.
This reversal is one artifact of the simplifying assumptions. The higher
the molecular weight, the worse is the assumption that the process is two-dimensional.
As the degree of polymerization increases, the process changes until, at
high molecular weight, it approaches the situation studied and described
by Arcus. Note that in the limit where a single chain occupies the entire
surface, a phase-transition-like behavior occurs at f = F.
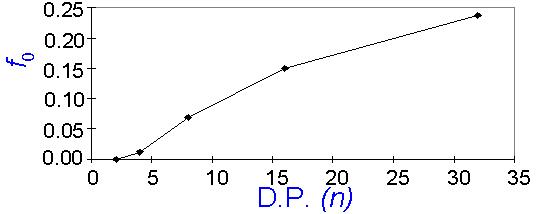
Examination of Figure 2 provides insight into another important variable, the critical base strength below which dissolution stops. In the probabilistic model, one may refer to a critical value of f, which is designated f0, for which Y~0. By recalling that f scales with the pH of the solution, one may recognize that f0 relates directly to the critical base concentration, c0, and represents a critical fraction of surface phenolic sites which must ionize in order for dissolution to occur at an observable rate. For practical purposes, let us define f0 as the base strength for which Y = 0.0004. In Figure 3, f0 is plotted versus the degree of polymerization, n. The critical base strength rises sharply with n for low molecular weight polymers, but the slope of the curve decreases for higher degrees of polymerization. From Figure 3, one may predict that f0 should approach an asymptotic value of 0.5 for very high molecular weight polymers. |
 |
| Figure 3 |
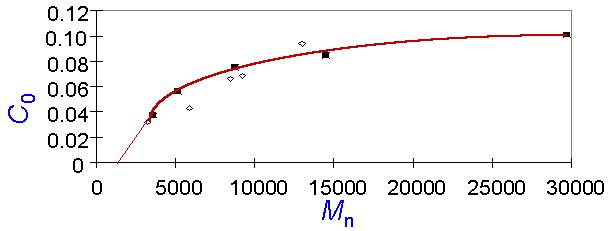
| A series of experiments designed to test these predictions were conducted. Dissolution rates were measured as a function of base concentration for a set of low-polydispersity poly(hydroxystyrene) (PHS) samples of varying molecular weight. The dissolution rate was found to depend exponentially on concentration. The dissolution rates were extrapolated to 1Å/sec, the defined basis for the critical base concentration, c0. A plot of c0 versus the number-average molecular weight (Figure 4) shows that c0 increases with molecular weight, and c0 rises more steeply for samples having a molecular weight less than 10 000 than for higher molecular weight samples. In addition, if these data points are extrapolated to even lower molecular weights than those measured, the extrapolation intersects the concentration axis very close to the origin. Thus, the probabilistic model for f0 exhibits qualitatively all of the trends observed experimentally for c0. |
 |
| Figure 4 |