| Surface Inhibition |
| Our research group has studied the dissolution of photoresists over the last
8 years in the effort to determine a fundamental mechanism for the
aqueous base dissolution of phenolic polymers.
This research has led to the critical ionization model for
dissolution, and the incorporation of this model into a molecular level
simulation algorithm. (See
Critical Ionization Model.) However, one aspect of dissolution that has
been difficult to explain is surface inhibition (or induction).
Surface inhibition describes a slow dissolution rate at the
beginning of dissolution (near the surface), and then an acceleration to
a faster, bulk dissolution rate (Figure 1).
In general, this behavior is observed in nonchemically amplified
resists (novolac polymer materials), but not in chemically amplified
materials (polyhydroxystyrene). The
goal of this project is to determine the fundamental mechanism of
surface inhibition. With a
fundamental explanation for this phenomenon, dissolution models can be
improved, rational design and processing of resists may be influenced,
and we will gain a more complete understanding of the dissolution
process. |
| Although a nonlinear dissolution rate might
seem detrimental, it actually can improve the shape of resist features.
A Prolith simulation is shown in Figure 2. in which a resist
feature is simulated with and without the surface inhibition effect.
With surface inhibition, the sidewall angle is improved, and
unwanted dissolution in unexposed areas of the resist (dark loss) is
also reduced. Thus, the
phenomenon is actually a beneficial effect. |
| Several theories exist for the origins of surface inhibition.
Many theories involve a maldistribution, or concentration
gradient, of resist components throughout the thickness of the film.
For example, it has been suggested that a concentration gradient
of residual casting solvent is responsible for surface inhibition.1
Our group has used radio-labeling techniques to measure the bulk
concentration of residual casting solvent in thin films.2
A natural extension of those studies is to determine
concentration gradients of residual solvent, but this requires a method
of separating individual layers of a resist.
We have developed a method known as the halt development
technique (Figure 3) to separate and analyze individual layers of a
resist. We have used
this method to measure the distribution of residual casting solvent, low MW
components, photoactive compound and density throughout ~1 mm resist films.
For more detailed reading, please consult references (3-5). |
 |
Figure
1. Dissolution profile of a film with and without Surface
inhibition
|
|
 |
| Figure 2. Simulated resist
line with and without surface inhibition |
 |
| Figure 3. Diagram of Halt
Development Technique. 1) A coated wafer is loaded into the cell.
2) Dilute developer is poured into the cell. 3) The resist is allowed to
partially dissolve. 4) The dissolved resist is drained from the cell.
5) The intermediate thickness is determined. 6) The top layer is
analyzed. The process is repeated for the bottom layer of resist. |
 |
| Figure 4. Typical results of the
halt development technique. Shown
is the PGMEA profile in a 1.3 mm novolac film at 70 and 110°C bake
temperature. |
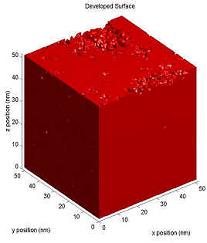
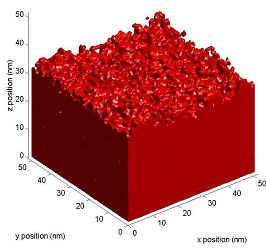
| An interesting theory for surface inhibition is derived from the lattice
model for dissolution. In the lattice model, thousands of polymer chains are equilibrated onto a
lattice, with the boundary condition that the top and bottom are
impenetrable. This creates smooth surfaces at the top of the film.
As dissolution proceeds, the surface roughness increases, the
surface area available to the developer increases, and the dissolution
rate increases accordingly. This
is shown in Figure 5. A pictorial of the lattice model is shown, as well as the average
roughness and the dissolution rate versus thickness.
In this example, the degree of polymerization is 30, the critical
ionization fraction (fcrit) is 0.6, and the fraction of
ionized sites (a) is 0.85. The void fraction in the lattice is 0.2. A more
detailed discussion can be found in references 3 and 6. |
|
| Figure 5. Increase in surface
roughness and dissolution rate predicted by the critical ionization
lattice model for dissolution. |
| References |
| B.T. Beauchemin Jr. and C.E. Ebersole,
Proc. SPIE, 2438, 261, 1995 |
| A.B. Gardiner, A. Qin, C.L. Henderson, S. Pancholi, W.J. Koros, R.R.
Dammel, C. Mack, W.D. Hinsberg, C.G. Willson, Proc. SPIE, 3049, 850, (1997) |
| S.D.Burns, A. B. Gardiner, V.J. Krukonis, P.M. Wetmore, G.M. Schmid,
J.Lutkenhaus, L.W. Flanagin and C. Grant Willson, Proc SPIE
(2001) |
| A.B. Gardiner, S.D. Burns, A. Qin, and C. G. Willson,
J. Vac. Sci. Technol. B, 19(1), 136, (2001) |
| S.D.Burns, A.B. Gardiner, V.J. Krukonis, P.M. Wetmore,A. Qin, and C.G. Willson,
Proc. Amer. Chem. Soc., PMSE, 81, 81-84 (1999) |
| L.W. Flanagin, V.K.Singh, C.Grant Willson,
J. Vac. Sci. Technol. B, 17(4), 1371-1379 (1999)
|
|
|

© 2006 Willson Research Group, University of Texas at Austin
Last updated
Site design by Arrion Smith and Obi
WEL 5.240, 512.471.3975
|